Catching code
Richard Copeman from Lauterbach explains how code coverage tools can ensure the safety of networked automotive systems
A modern vehicle will have somewhere between 30 and 100 microprocessors on board running all aspects of the driving experience – braking, engine management, gearbox control, steering and many safety related features. Each of these will be running dedicated embedded software; vehicles have become a network of embedded devices.
Of paramount importance to safety is the quality and reliability of this software. Not only does each device need to respond to local and network real-world events in a timely and deterministic fashion, but it must be able to cope with the unexpected and do it reliably time after time after time. Emerging safety standards such as ISO 26262 are trying to mandate processes and procedures for ensuring software quality and reliability. One aspect of this process is code coverage.
Debugging
In recent years massive product call backs and safety related software failures have proven both tragic and costly. The cost to the industry and the damage to various brands have been considerable. With the constant evolution of networked enabled automotive systems, there is a big push to develop new methods to test and prove the software that controls them.
In the world of software quality, code coverage takes many forms, such as function, statement, branch, decision and condition coverage.
Function coverage provides a check that each function in a system has been called. This is the most basic level of code coverage.
Statement coverage is used to prove that each statement in a programme has been executed. It will only be satisfied if every statement in a function has been executed. This may require calling the function multiple times with different arguments to ensure this. It is recommended to verify that the chosen compiler generates code that includes a branch for each high-level language conditional statement. Another thing to check is that the selected compiler does not produce different object code when building debug versus release variants of an application.
Branch coverage is to prove that each branch has been taken and not taken.
Decision coverage is to prove that each branch of each control structure in the target has been tested; conditions must be both met and not met. This is not the same as branch coverage.
Condition coverage requires that each sub-expression of a complex condition has been evaluated to both true and false.
The above list covers the basics; there are many more forms of coverage, each measuring a different metric of the code under test.
Traditional approach
Traditional test suites use an instrumented variant of the software to log waypoints into a buffer on the target or to stream this data off-target via TCP/IP, serial or USB. These waypoints are analysed afterwards to determine which tests have been completed and what measure of coverage has been obtained. Complex suites can script multiple tests to capture a more complete set of data.
This method has some drawbacks. The software that is being tested is not the released software; it is an instrumented version and will behave differently. Since the target software has been instrumented there will be extra strain placed on limited target resources, for example extra stack space is required to push local variables to call the logging functions. With all the logging going on there will be an impact on the real-time performance of the application – it may miss deadlines due to being a logging mode when it should be responding to real-world events. Despite these drawbacks, these tools have their place and provide a good set of data and reports to aid in verifying software to proven safety standards. There is another way.
Trace approach
Many devices that are aimed at the embedded market provide a member of the family or a variant with a trace port. There are many trace technologies but all have a common feature – they provide a non-intrusive way of tracking what the software is doing. As a minimum they will provide a complete branch trace of the programme flow, without instrumentation and without affecting the performance of the code being executed.
A trace port uses a number of pins on the package to provide information about code and data coverage while the processor is executing. The actual number of pins used depends on the trace technology implemented and the width of the trace port. Recent developments in microprocessors are moving from parallel trace ports to high-speed serial trace ports. This becomes important as trace port clock frequencies increase and the signal skew inherent in parallel data buses starts to play a significant role in limiting the quality or speed of the trace data captured. The trace data are streamed off-chip to be collected by hardware tools. The stream is decompressed, processed and sent to a host PC for final analysis and display. Typically, these tools will have several gigabytes of storage to hold trace data.
Some microprocessors provide dedicated on-chip trace buffers (such as Arm's ETB embedded trace buffer) but these are often very small and are unlikely to capture enough data for a meaningful set of results. These are designed so the extra pins required for an off-chip trace port are available for IO or other purposes and to reduce the overall cost of the package. They may help software developers in tracking down some bugs but, in general, do not provide enough information for detailed code coverage analysis. However, they may be useful for very small samples of code coverage analysis – a function or two at best.
It should be mandatory for any safety critical system that the engineers understand the internal operation of the processor selected and the trace port technology provided by that processor. Failure to understand the data provided by the processor's trace port will make collecting and analysing code coverage information tricky, if not impossible. For example, the IEEE5001 Nexus specification allows trace packets to be dropped: if multiple packets are queued at the same time, only the highest priority packet will be placed in the trace buffer.
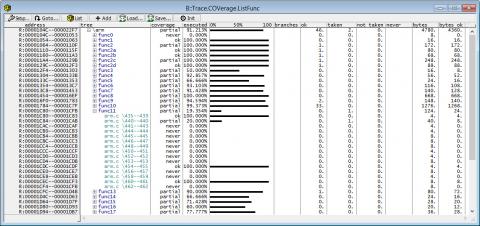
The trace data provide a list of all the branches in the software that have been taken. This easily allows the tool to calculate function, branch and statement coverage. An example can be seen in the diagram, showing functions and C source lines within functions and their respective statement and branch coverage details.
There may be a good reason why several of the cases in the switch statement in func11() were never executed. This code can be annotated to indicate this or any other important information that will be included as part of the final report that is generated.
The mode can be changed to view individual assembly instructions. This can be especially useful in highlighting where a complex high-level language condition shows only partial coverage.
Multiple trace samples can be aggregated to provide an overall picture of coverage for several test runs. This makes it very well suited for integration with traditional software analysis suites, which can automate a lot of the required testing for software compliance.
The trace tools work with devices that have multiple processing cores in them and coverage reports can be generated for each core or for all cores in the system. The trace protocols used allow for individual trace packets to be tagged with which core generated them.
A modern multi-core processor will generate huge quantities of trace data and for longer tests the size of the trace buffer ram in the tool is becoming strained. The tools can be placed in a mode where the 4Gbyte of buffer in the tool is used as a large fifo to smooth out the peaks and troughs in the trace data and then the trace data are streamed over a high speed connection to the host PC for storage or on-the-fly analysis.
Conclusion
To address the requirement for absolutely safety and reliable performance in network-enabled vehicles, debug tool companies are working closely with the silicon companies. While the silicon developers are exploring new technologies that enable code to be exported for analysis, the debug tool companies are striving to provide ever-greater visualisation of the code, better proof of performance and more accurate detection of errors. In reality this involves the transfer and analysis of massive amounts of data at enormously high speeds.
This level of debugging has only recently become possible and it therefore requires a very modern tool-chain. In the automotive sector, such an investment is now essential, helping to reduce the risk of a product recall or a damaged reputation. In this respect, advanced debug tools have a bigger role than ever to play in automotive software development.
Richard Copeman is a field application engineer with Lauterbach