Test & Measurement: Deep inside the pulse
Cyril Noger from Anritsu explains how a vector signal analyser helps optimise the performance of low-cost radio modules in tyre pressure monitoring systems
Wireless communications capabilities are adding more and more value to today’s electronics devices, often helping to improve their performance or to make them more convenient, safer or more enjoyable to use.
In many cases, embedded radios have a relatively simple function and are required to transmit small amounts of data over a short range. The radios used in M2M communications also often have moderate performance and range specifications. For the end-product manufacturer, the most important attribute of such radios, provided that they can fulfil their basic function reliably, is generally low cost.
So surely it follows that users of basic, low-cost radio modules can use basic, low-cost methods for analysing the modules’ radio signals and for verifying their performance.
In fact, today’s basic embedded or M2M radio, typically operating at up to 1GHz, will have tightly defined specifications for operating parameters such as frequency, power and phase: there is very little tolerance for operation outside these specifications if the radio is to perform reliably.
OEMs using such radio modules therefore have much to gain from the analysis capability of the latest vector signal analyser (VSA) type of measurement instrument – a sophisticated tool, but one that is highly appropriate for the testing of basic and low-cost radios.
Limitations
For many years, the spectrum analyser was the most popular type of test instrument used by radio technicians and engineers. The primary function of a spectrum analyser is to display a graph plotting power against frequency, and so to tell the engineer whether a device is transmitting at its specified frequency or frequencies.
But what if the engineer wants to drill down into this representation of the signal to gain a more detailed, granular view of it? A conventional spectrum analyser is very limited in its ability to do so, because of its relatively slow speed.
This is why the spectrum analyser has evolved a new category of instrument: the VSA, also known as an FFT (Fast Fourier Transform) analyser. Much faster than a spectrum analyser, it allows the user to see transient signals that are hidden to the spectrum analyser. Crucially, the VSA provides sufficient detail to enable the user to see the operation of the many and varied modulation schemes implemented by embedded radios.
Today, test equipment manufacturers tend to combine a spectrum analyser and a VSA into the same chassis: the spectrum analyser allows the user to analyse a signal quickly at a high level, whereas the VSA reveals detailed information about what is going on inside the signal, such as modulation schemes, interference and transients. Some VSAs also include a vector signal generator (VSG), which can reproduce captured, digitised signals at any chosen carrier frequency and power level.
Application
In the past, then, radio signal analysis – whether in product development, in production or for troubleshooting in the field – would have been implemented with a spectrum analyser. As embedded radios have become more sophisticated, with more complex waveforms and modulation schemes, the need for more detailed analysis of the signal has become apparent.
This may be best illustrated by reference to an application example. Today’s sophisticated connected car contains multiple radios, including the GPS navigation system, a mobile telephone transceiver and even the simple wireless key fob for locking and unlocking the vehicle.
Another of the car’s radios is in the tyre pressure monitoring system (TPMS). This monitors the pressure of each tyre and sends its readings to an ECU. If the pressure falls below a pre-set threshold, an alarm on the dashboard warns the driver to re-inflate the tyre.
Now found in almost every mid-range and high-end car, TPMS technology is subject to the automotive industry’s close attention to cost reduction. This means that TPMS equipment manufacturers use low-cost wireless chipsets that are produced in very high volume. The automotive industry, however, focuses on quality as relentlessly as it does on cost: this means the performance of each TPMS unit has to be verified rigorously before being integrated into the car.
Modulation scheme
In a TPMS, the tyre pressure readings are sent periodically from each tyre as a short burst of data – TPMS signals can be considered to be pulsed signals. The information (the bits) in each pulse are encoded in the form of a modulation of a carrier wave. The most common modulation technique used by TPMS radios is frequency shift keying (FSK): simple binary FSK uses two adjacent frequencies, with one frequency representing a binary 1 and the other representing a binary 0.
The transmitted pulses are short. The older spectrum analyser type of instrument could show the shape of this signal but, because it was slower, it was not able to reveal the detail of the modulations occurring within each pulse. This is where the VSA offers the engineer new capabilities thanks to its high measurement speed and its sophisticated calculations.
In addition to the power versus time analysis displayed by both the spectrum analyser and the VSA, the VSA also measures a domain that the spectrum analyser cannot: frequency versus time.
This feature of the VSA allows the user to view the operation of the modulation scheme within each pulse. Thanks to its high accuracy and sampling speed, the VSA can show the two bits of information, one higher frequency and one lower frequency.
Since the VSA can analyse two measurement domains of the same signal (frequency versus time and power versus time), it also enables the user to focus on a smaller part of the pulse if needed for a deeper signal analysis.
The signal analysis makes it easy for the user to verify whether a TPMS device is working properly, since it shows the value of the two frequencies inside the burst. Markers can be used to measure the duration of each bit, and also verify the frequency difference between the upper and the lower frequencies. For the wireless chipset designer, this information helps in the development and characterisation of the device; for the manufacturer, it provides for fast and accurate measurement to determine whether the radio module is within its specifications or not.
Indeed, for this TPMS application the production engineer could be fully confident in the performance of a low-cost radio module just on the basis of these two VSA measurements: frequency versus time and power versus time.
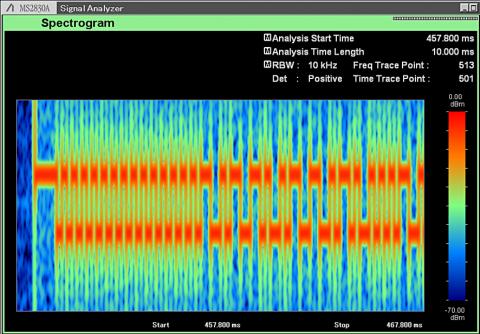
Design engineers developing complete TPMS modules might also use a further type of information from a VSA, particularly when benchmarking radio modules from different vendors: the spectrogram display mixes three kinds of information on the same graph. These three are frequency, amplitude and time.
The diagram displays a typical example of a spectrogram display of a TPMS radio module.
This spectrogram provides an excellent means to uncover transients or unwanted spurious signals. This again is a capability of the VSA that conventional spectrum analysers cannot offer.
It is worth noting that a VSA can also display phase versus time. This is not discussed here, since TPMS signals do not use phase modulation.
Many VSAs also include additional software with which the user can configure the measurements and decode the behaviour of a TPMS module. With this vector modulation analysis (VMA) software, graphical and numerical results can be provided simultaneously on screen.
A modern VSA also provides automation capabilities so the performance of the device, characterised with a VSA in the development phase, can be quickly and efficiently verified in production.
In addition, an embedded VSG provides a powerful means to troubleshoot a faulty device, by generating wanted or unwanted signals and inserting them into the device under test, and by replaying captured, digitised waveforms.
Conclusion
The capabilities of a VSA described have been illustrated through the example of the signals generated by one kind of simple, low-cost radio module: the radio in a TPMS. As the article has shown, the speed of the VSA enables it to drill down into the detail of the signal to reveal minute detail about the modulation of the carrier waveform.
To function correctly in a car, the TPMS radio has to maintain a specified difference between the higher and the lower frequency, and to maintain a specified duration for each bit: the VSA displays the signal’s waveform in sufficient detail for the user to take these measurements accurately.
This shows that the capabilities of a VSA are essential to the testing of one type of low-cost radio, the TPMS. But the analysis provided by a VSA is equally useful for the testing of any other kind of low-cost embedded radio module, and makes the VSA now an essential tool for both development and production engineers, superseding the conventional spectrum analyser.
Cyril Noger is wireless products support engineer at Anritsu