Vehicle Networks: Can the Can
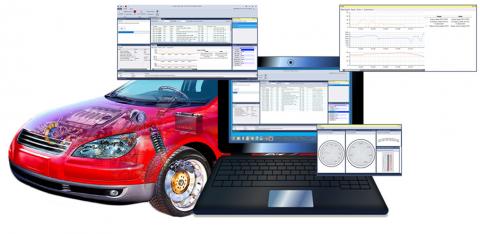
Chris Quigley, David Charles and Richard McLaughlin from Warwick Control Technologies explore the use of Can bus message electrical signatures for automotive reverse engineering
There are many applications in which you may need to reverse engineer the Can, such as automotive competitor analysis, telematics applications such as fleet management and disabled driver applications.
The typical reverse engineering process is concerned with moving a sensor and watching the Can bus for message changes. For example, wind down a door window and see if this kicks off changes in Can message data.
Many Can buses have many messages originating from many ECUs. This means it is difficult to watch all of them at the same time. It would be far easier if it was possible to watch a smaller number of Can messages to observe changes by isolating the ECUs from which the messages originate.
A process that allows the user to identify which Can messages are transmitted by a particular ECU is achieved by getting the electrical signature of each Can message and matching known Can messages with unknown ones. Therefore, the transmitting ECU of the unknown Can messages can be determined.
The method for determining which identifiers come from a particular ECU is first to get electrical signature plots of known diagnostic response messages and compare with electrical signature plots of the real-time control messages.
Signature
A Can message electrical signature is something that is largely unique about any message sent by an ECU. Therefore, it would be expected that all messages transmitted by an ECU to have the same electrical characteristics. For example, a Can message comprising of the voltages of Can High and Can Low (Can_H and Can_L) should show something unique for each ECU due to the physical makeup of the Can bus, for example node position and distance on the bus.

Fig. 1 (above) shows different fields that make up a Can frame. Due to the nature of the contention-based access method of Can, the arbitration field (Can ID) should not be considered for the electrical signature, as there may be several ECUs communicating within this field and therefore influencing the electrical signal.
Once the arbitration process is completed, there is just one ECU producing the data field. This is where a unique electrical signature for this ECU can be seen. To obtain a unique signature for a Can message that represents its transmitting ECU, the measurements should be taken from this part of the Can frame, which is when only one ECU is generating the Can data.

To illustrate the unique electrical characteristics of each ECU in a vehicle, Figs. 2 (above) and 3 (below) show the slight differences in the Can_H and Can_L voltages for two different ECUs from a modern passenger car. These are referred to as ECU A and ECU B.

It can be seen that the Can_H and Can_L voltage levels are different for the messages of these two ECUs.
Generating signature
The methodology considered in gathering an electrical signature for each Can message, to ascertain the ECU it comes from, is to consider the Can_H and Can_L voltage values to associate messages to ECUs.
The method is to analyse the voltages of Can_H versus Can_L. To do this:
- • Log one example of each Can message oscilloscope trace
- • Isolate the data field only
- • Split data field bits into dominant (logic 0) and recessive (logic 1)
- • Calculate modal average value of Can_H and Can_L voltage levels for dominant bits only
The data are now ready for cluster plots.
Example

Fig. 4 (above) shows the display on an oscilloscope. Here, Can frames are logged on the top half of the display. One of the Can frames is selected (highlighted), and the physical signalling of that frame is shown on the lower half of the display. Note that from this, the voltage levels of the dominant bits in the data field (Can_H, Can_L) can be gathered.

These waveforms can be exported as an Excel file to show readings of the Can frame at a sample point. An example of the data that are exported is shown in Fig. 5 (above).
The information given in the Excel file is:
- • Frame ID (hexadecimal)
- • DLC
- • Data (bytes in hexadecimal)
- • Error frame (true or false); false if a good Can frame
- • Samples per second
- • Exported on (date)
- • Time of sample for that frame, starts at zero
- • Can_H and Can_L voltages
- • Region name (region of the frame the data showing are in)
- • Additional region, shows where bit stuffing occurs.
Once this information is exported to Excel, cluster points can be calculated by taking the modal average of Can_H and Can_L voltages from data field (dominant bits only).
Analysis and clustering
The data are analysed by recording the level of Can_H and Can_L dominant bit voltage levels within the data field and coming up with a single modal average measure for both Can_H and Can_L. These can then be put onto a cluster plot so that the clustering of Can messages from a particular ECU can be observed.
The case study below illustrates the data collection methods and process used in plotting the Can ID clusters from the Excel modal average values. This allows a researcher or engineer to ascertain from which ECUs the real-time Can messages originate.
Case study
The basis for this methodology is that each ECU on the Can bus will exhibit its own unique electronic characteristics, which are influenced by aspects such as its electrical components and tolerances, Can transceiver, connector characteristics and location in the Can bus. This can therefore be used to match unknown Can frames with known Can frames.
In the automotive industry, the real-time control Can messages are proprietary. However, the identifiers diagnostic messages used for manufacturing and service garages are standardised in specifications such as ISO 15765 and/or across an automotive manufacturer.
Many vehicles using standard Can identifiers make a diagnostic request to the engine controller using Can identifier 0x7E0 and the engine controller will respond on Can identifier 0x7E8.
Therefore, the summary of the methodology is described by: send diagnostic requests; get signatures of all responses and real-time messages; and analyse and plot the data on a cluster diagram.
Diagnostic requests
An oscilloscope is used to receive the diagnostic response message for analysis of the physical signature. This will see the sent transmitter (0x7E0) and read the response to this message of ID 0x7E8; 0x7E8 can then be analysed through an analogue network analyser.
More information about the diagnostic request can be found in ISO 15765-4: 2016. The basic information needed is that diagnostic requests have the hexadecimal Can IDs ranging from 0x700 to 0x7FF. The standard emission diagnostic request message is known to be ID 0x7E0 and the expected response from the engine control module (ECM) is ID 0x7E8. From ISO 15765-4, it also known that the transmission control module (TCM) diagnostic request ID is 7E1, and the response message is 7E9.
Many of the other ECUs are manufacturer specific, but most can be ascertained using an OBD tool for a particular car model. For example, in many models, the ABS ECU is known to have a request of 7E2 and a response of 7EA.
A diagnostic response’s ID will increase in value by 8 and give the response:
- Request ID = 0x7E0 Response ID = 0x7E8 8 = 7E8 – 7E0
An example of a 0x7E0 diagnostic request Can frame is:
- ID = 0x7E0 DLC = 8 Data = 02 10 01 00 00 00 00 00
Therefore, a response can be expected from the emissions (engine) ECU on Can ID 7E8.

If there is no response to other requests, it means this diagnostic function is not supported in this vehicle. The plotted chart in Fig. 6 (above) shows the diagnostic response messages in the first candidate car. From this, the electrical signatures of Can IDs 728, 7E8 738 and 768 were ascertained. From the manufacturer’s specification, it is possible to establish the functions of these ECUs.
Data capture
The clusters will show which messages are associated with the same ECU. Two candidate vehicles – Candidates 1 and 2 – were electrically good Can buses, that is good earthing and less noise. The methodology used was to plot the modal Can-H and Can-L values from the data segment of the Can frame to produce the clusters. This modal value would be taken from the region of the data field for dominant bits only.
In the first candidate vehicle, the diagnostic request messages were sent with the response results that plot the electrical signature shown in Fig. 7 (below).

Here the cluster points were plotted using Can_H versus Can_L. From the specification of this vehicle, the resulting diagnostic response messages are interpreted as follows:
- • 728 – Instrument cluster
- • 7E8 – Engine ECU
- • 738 – Steering ECU
- • 768 – Brake control module ECU
After the diagnostic response signature is established, the real-time Can control messages were collected and the electrical signature plotted, as shown in Fig. 7 (above).
Here, the general electrical signatures of the real-time Can messages closely match up with the diagnostic response messages. Therefore, it can be ascertained that the messages come from the following ECUs:
- • Instrument ECU – Can IDs 190, 275 430, 433, 460
- • Engine ECU - Can IDs 200, 201, 205, 231, 268, 280, 420, 428, 4F0, 4F1, 4F3
- • EHPAS ECU – 240
- • Brake control module ECU – 20F, 211, 212, 4B0
This information will allow reverse engineering methods to help ascertain the functions of these Can messages. It is possible to isolate these messages and perform various investigation methods to determine the functions of the individual signals within these messages.
Candidate 2
To verify the validity of this method further, a similar method was performed on a second candidate vehicle for which the Can specification was available. The result is illustrated in Fig. 8 (below) showing the electrical signatures of the real-time Can data of this vehicle.
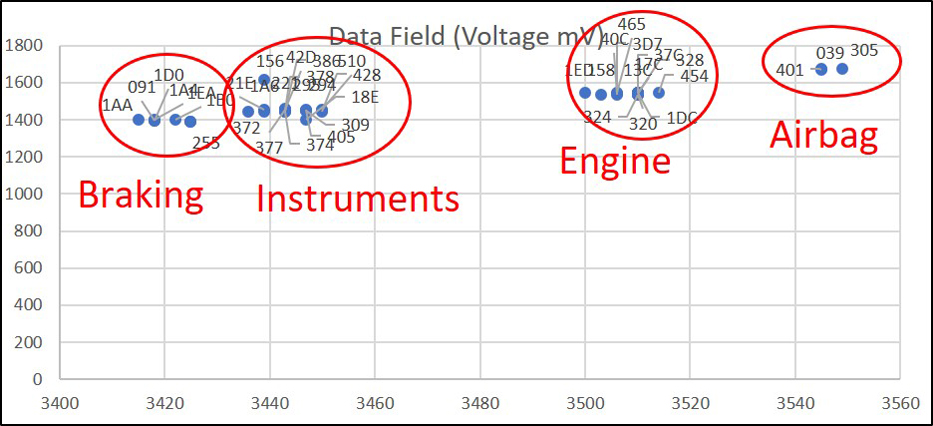
Here it can be observed that the messages come from the following ECUs:
- • Braking ECU – Can IDs 091, 1AA, 1A4, 1B0, 1D0,1EA, 255
- • Instrument ECU – Can IDs 156, 18E, 1A6, 21E, 221, 294, 295, 309, 372, 374, 377, 378, 386, 405, 428, 42D 510
- • Engine ECU – Can IDs 13C, 158, 17C, 1DC, 1ED, 320, 324, 328, 376,3D7, 40C, 454, 465
- • Airbag ECU – Can IDs 039, 305, 401
Conclusion
The method shown here can be used as evidence to support hypotheses when reverse engineering. Many times during reverse engineering exercises engineers want to isolate Can messages from a particular ECU. This method of plotting electrical signatures by noting the modal average of Can_H versus Can_L levels for each message data field has shown that it is a very good assistant in accomplishing this.
The approach shown is not limited to Can bus technology. Can-FD is the obvious next bus to consider. However, electrical signatures could be obtained for many other bus and network technologies for example Flexray, which uses a differential signalling approach. It may be possible to characterise the signals on a Lin bus. However, a slightly revised approach would need to be adopted for deriving an electrical signature since it does not use differential signalling.
Chris Quigley is director, David Charles electronic technician, and Richard McLaughlin sales and marketing director at Warwick Control Technologies

Comments
Interesting! Thank you!
Interesting! Thank you!